Lui’s Lowdown on the Stock Market: A bird in hand is now worth more than two in the bush…

By John Lui - Chief Investment Strategist
The stock markets rapid moves from Overbought to Extreme Oversold to Overbought indicate investors are emotionally stressed as they switch between Fear and Greed…

Charles Schwab
The furious flipping between fear and greed happens when investors crowd into price momentum strategies. The momentum style factor (others are value, size, quality and low volatility) has been the number one factor in determining stock return outperformance due to the zero interest rate policies (ZIRP) put into place by central banks globally to combat the Great Financial Crisis (GFC). ZIRP lowered the opportunity costs for passing up on bond interest payments or stock dividends to lure investors into stocks where the return on invested capital payoffs would be decades away or never (remember all the SPACs/Special Purpose Acquisition Companies in 2021).

A total return approach (dividends and price appreciation) is the better risk/reward way to invest this late into the crowded price momentum trade. How late is it into the price momentum game? (see the Return of the SPAC King pictured).
The “bird in hand” is the dividend component of total return, where dividends have historically been 40% to 50% of the total return. As I recently told a new client: out of favored dividend stocks are today’s “ugly ducklings”.
The 8 largest stocks in the S&P 500 are tech stocks that pay little or no dividends…

The S&P 500 is closer to a technology fund than a well diversified stock index as technology is 40% of the S&P 500. Look at how the S&P 500’s TOP 10 companies were much more diversified 30 years ago and dividends were also a greater portion of total return. Just look at how diverse the companies were back in 1995.
Today’s S&P 500 is also more risky and more volatile now due to the concentration in technology as the TOP 8 are all tech firms, accounting for about 33% of the benchmark.
People forget that technology companies have high obsolescence risk as some new company with a new technology will come along and “eat their lunch”. Just look at how IBM, Intel and Cisco prospects have faded since 2000.
Be wary of projections that ascent neatly at a 45 degree angle ...
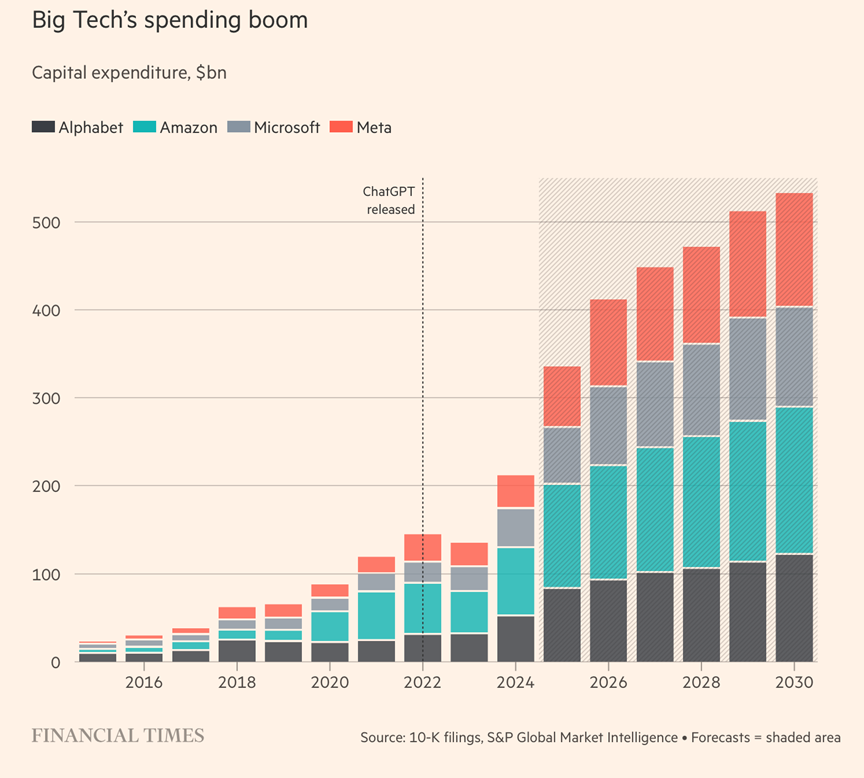
I have seen too many Power Point presentations with bar charts that ascend neatly upward at 45 degree as they embed too much optimism. So it makes me wary and cautious when I see the Big Four Tech’s (Alphabet, Amazon, Microsoft and Meta) projections for capital expenditures driven by AI spending going up neatly at a 45 degree angle. These companies get goofy because they have the cash to burn and the growth narrative does wonders for their stock prices. Where are all the driverless cars and what has become of augmented reality?
Just look at how wrong Amazon got it in during COVID 19. Amazon over invested during 2020, 2021 and 2022 and pulled back in 2023; they now have a glut of employees and warehouses, and their head of logistic is no longer with the firm.
Amazon’s 2026 capital expenditures are projected to be about equaled to the previous peak for the entire Big Four in 2022. Meta also over invested both in augmented reality and for COVID and Zuckerberg pulled back on spending with big layoffs in 2023, declaring it “The Year of Efficiency”.
Lastly, my December 2024 strategy piece which focused on relative valuations for the Mag 7, highlighted they are all great companies, but some are priced more expensively than others. Just as you rigorously price a vacation to the Top 7 selfie destinations, is the market doing so with the Magnificent 7?
Here are the Price/Sales again as of December 1, 2024 for the Magnificent 7...

NVIDIA was the most expensive at 30.8 times while AMZN was the cheapest at 3.8 times. So NVDA at 30.8 Price/Sales was 3 times more expensive than META and about 4.9 times more expensive than GOOGL. As a reference point, the current S&P 500 Price/Sales ratio is 3.2 times. Valuation matters and it takes time for the market to reflect it in price performance. I have used Bloomberg’s system to get price performance to see if the market is efficiently pricing the MAG 7.
Below is a chart of how the MAG 7 has performed (price performance) from December 1, 2024 to September 2, 2025.

Source: Bloomberg
Next is a chart of how the MAG 7 has performed (price performance) from August 1, 2025 to September 2, 2025.
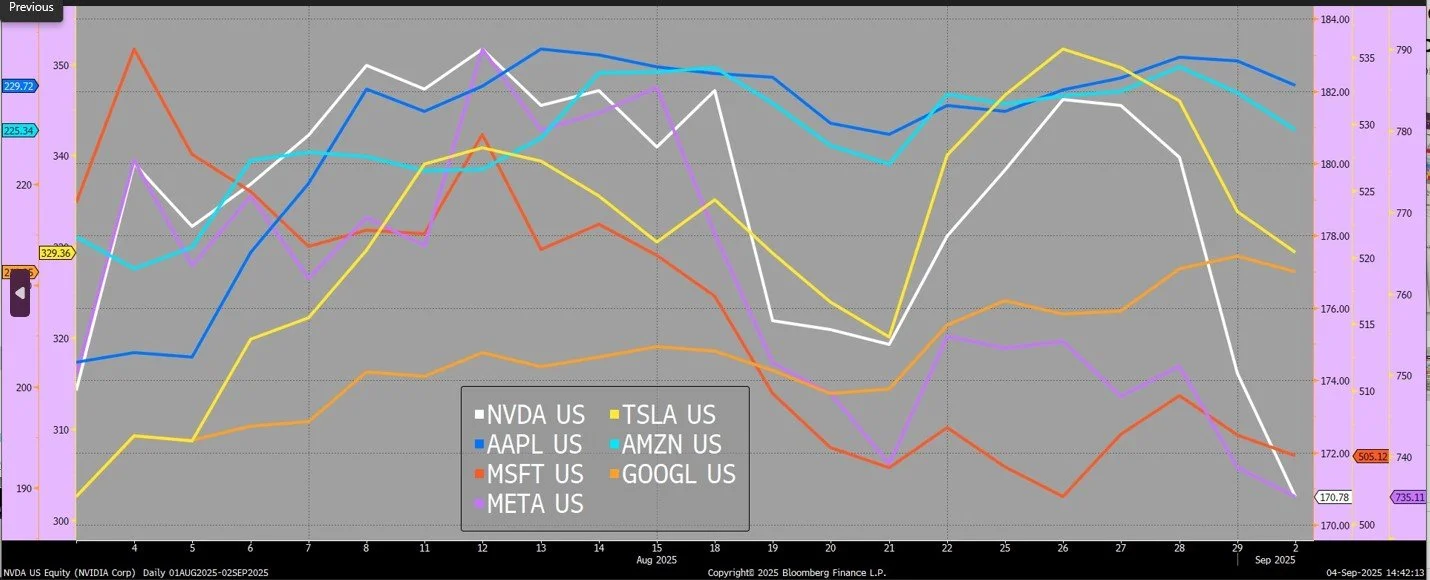
Bloomberg
As fiduciaries, managing money means managing both risk and reward. During periods of extreme “fear of missing out” (FOMO), risk management is neglected.
Please reach out to your relationship manager and/or your portfolio manager if you have questions or concerns.
Disclosure
Chatham Wealth Management is registered as an investment adviser with the SEC. SEC registration does not constitute an endorsement of the firm by the Commission, nor does it indicate that the adviser has attained a particular level of skill or ability.
Past performance may not be indicative of future results. All investment strategies have the potential for profit or loss. Different types of investments involve varying degrees of risk, and there can be no assurance that any specific investment or strategy will be profitable for a client's portfolio.