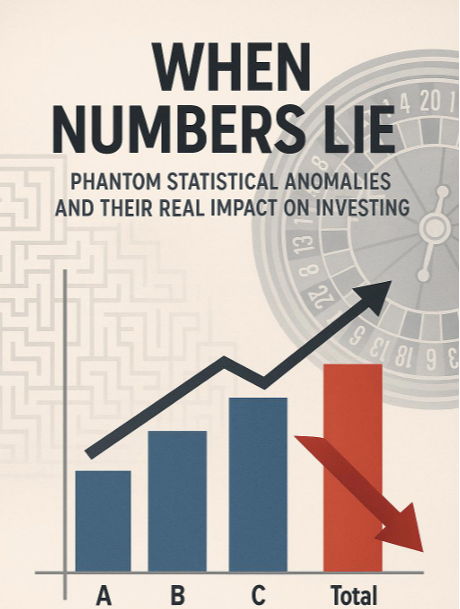
WHEN NUMBERS LIE - Phantom Statistical Anomalies And Their Real Impact on Investing
By John Hanna - Director of Operations
KEY TAKEAWAYS
Simpson’s Paradox
When a trend appears across different data sets but disappears- or even reverses- when the data are combined and analyzed together.
The Ergodicity Fallacy
The mistaken assumption that the average outcome across a group (ensemble average) is the same as the average outcome over time for an individual (time average).
What Can You Do
Question the Average : A good average doesn’t mean a good outcome for you.
Focus on the Time Path : Ask: “What happens to my money as it grows or shrinks over time?”
Disaggregate the Data : Don’t just look at the big number, understand the parts behind it.
Respect Uncertainty : Markets aren’t neat. Models are useful, but they’re not gospel.
In investing, we often lean on statistics for guidance. But what if some of these numbers mislead more than they inform? Two classic examples reveal just how easily statistics can paint a false picture. And in finance, false pictures can cost you real money.
Simpson’s Paradox
In 1995, New York Yankee Derek Jeter had a batting average of .250 and in 1996 he hit .314. In those years, David Justice of the Atlanta Braves recorded higher averages hitting .253 and .321. At first glance, it looks like David Justice had the better two years. Even averaging the two numbers for each player, Jeter comes to .282 and Justice .287. Case closed, right?
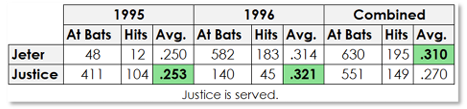
Actually, it turns out Jeter was the better hitter over that span and it’s not even close. He hit a combined .310 while Justice hit .270.
Same data, opposite conclusions. So, what’s going on?
The above is an example of a statistical trap called Simpson’s Paradox which occurs when a trend appears across different data sets but disappears- or even reverses- when the data are combined and analyzed together. Here it’s obvious that number of at bats- the data points- affects the combined stats differently than when analyzed by individual year and it’s the weighted average we should really be considering.
There are real-world implications for not knowing the true characteristics of the data you’re looking at. Not accounting for things like sample size, time period, subgroup definitions, and other relevant impactful characteristics can lead to serious investing missteps like:
1. Picking the wrong fund or manager: Like the batting average example above, a fund can show individual yearly underperformance of a peer but in aggregate, might actually be the winner.
2. Misjudging sector allocations: An investor comparing two portfolios might see that Portfolio A beat Portfolio B overall. But digging deeper could reveal that Portfolio B outperformed in every sector except a high-flyer that Portfolio A just had heavier weight in. Portfolio B’s manager could be the better stock picker.
3. Diversifying incorrectly:You might believe combining two strategies (each good in their own category) leads to better performance. But depending on how they interact, the combined return could be worse.
The takeaway here is that to counter statistical anomalies, it’s important to analyze data at the most detailed and complete level available. When analyzing an asset’s performance, using daily compounding returns rather than monthly or annual will result in a more accurate representation of total return. This is especially important when determining what strategies you might want to run together.
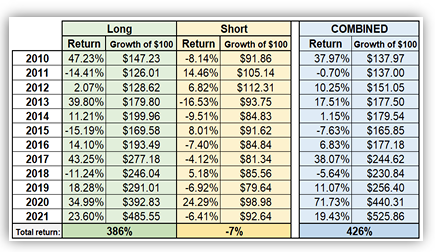
For example, the chart on the left shows hypothetical annual returns for two investment strategies- one that uses just long positions and one that only sells short.
Compounding annually, the longs totaled a solid 386% and the shorts lost around -7%.
Intuitively, one may be tempted to simply add the 2 returns together (379%) and conclude that just running the long strategy by itself is best.
But when we analyze the data together, and mimic daily performance as if we were running both strategies simultaneously, the total return for the combined strategy jumps to 426%. The short component- though by itself has a negative return- adds alpha because though it lowered performance on up days by .001% on average, it reduced losses on down days by an average of .04%. Over the course of 2,871 days tested, this added downside protection is significant.
Accounting for Simpson’s Paradox and other statistical anomalies can help fund managers make sounder investment decisions. Adding a strategy that on the surface may look like a drag on returns might actually help. And this is pretty much what hedging is all about- finding that perfect complement that adds balance and harmony (and alpha!) to an existing model.
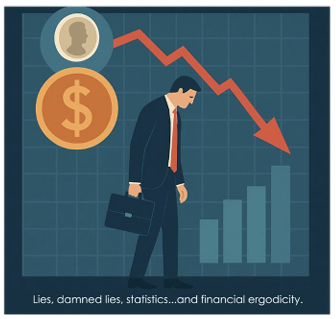
The Ergodicity Fallacy
Stats, numbers, averages, probabilities: all presented to us to help us invest with conviction. But what if what we’re receiving and accepting at face value doesn’t tell the whole story? Worse, what if it tells the wrong story?
Much of what we consume about investing and economics assumes "ergodicity", a fancy word meaning "the average result of many people or scenarios is the same as what one person will experience over time". But that's not how life actually works and this matters a lot.
In an interesting lecture, "Introducing irreversible time in economics", Dr. Ole Peters discusses the importance of accepting that life happens in time, not across parallel universes. So we should focus on what happens to one person over time (time averages), not what happens across lots of imaginary people (ensemble averages). In reality, the "average" result economists talk about can lead to bad decisions, because it doesn't match what actually happens to people in real life. Dr. Peters concludes that when making decisions involving leverage, it's better to focus on how those decisions affect your wealth over time, rather than relying solely on average expected outcomes. This encourages more cautious and sustainable strategies that better align with individual experiences in the real world.
He illustrates this concept using this coin flip experiment.
The Coin Flip Experiment
Let’s say you’re offered an opportunity to invest in a fund where returns are based on a coin flip such that each time it lands on heads, you gain 50% of your current money. When it lands tails, you lose 40%. On average, you gain 5% with each flip (because 50% - 40% = 10% / 2 = 5%).

So, let’s do some flipping and see what happens to $100. In this chart, we recorded three HEADS at +50% and 3 TAILS at -40%. This averages to that 5% you were promised. But in reality, the total return is a dismal -37.10% with a compounded growth rate at a disappointing -5.13%, almost the exact inverse of what you were sold on.
If you’re experienced in stats, chances are you spotted from the get-go what’s wrong with the 50%/-40% return structure, which is if you’re down 40% on $100 a rebound of 50% only gets you back to $90. In fact, you’d need 67% to get back to even. Similarly, if a real-world investment drops 50%, it’d need a 100% bounce just to get back to even, a stat that often surprises people.
This example doesn’t even take into account the real probability of a sustained losing streak, or starting off with multiple tails rolls- just 4 in a row to start gets you down to 13 bucks! In fact, humans are remarkably bad at predicting the randomness and streaks in 50/50 outcome structures.
To illustrate this concept, renowned mathematician (and former magician- very telling) Persi Diaconis conducted an experiment where he asked one group of students to flip a coin 100 times and record the outcomes and a second group to fake doing so. With great accuracy, he was able to tell which group was which because humans tend to avoid long runs of the same outcome in a row thinking they look suspicious or "unrandom." (Remember being stressed out when you answered too many A’s in a row on an exam?!)
Real randomness includes streaks, and a losing one can be devastating. Just ask anyone who has tried the Martingale System in gambling. This strategy has you double your bet each time you lose a game with 50/50 odds. As long your bankroll is big enough, once you win, you recoup your losses. (This is the reason the green 0 and 00 and betting size limits exist at a roulette table.)
In the real world, not being prepared for losing streaks or not considering the real possibility of catastrophe can be devastating. And this is exactly what happened in 2008.
The Real-World Example: The 2008 Financial Crisis and Risk Model
Let’s look beyond hypotheticals and thought experiments and look at the very real-world risks of relying on ergodic models. Before the 2008 financial crisis, many banks used risk models like Value at Risk (VaR) to estimate how much money they might lose on a “bad day.” These models were built on average-case assumptions and often relied on normally distributed returns meaning they expected extreme losses to be incredibly rare.
For example, a typical VaR model might have said "There’s only a 1% chance we'll lose more than $10 million in a day." But when mortgage-backed securities started to collapse and correlations between assets surged, everything dropped together. Perhaps accounted for “1-in-100-year” events started happening regularly partly because models treated markets as ergodic, as if averaging across time and across scenarios were equivalent. But the financial system is deeply non-ergodic and when everyone runs for the exits at once, losses compound fast. What looked safe on average turned out to be catastrophically risky over time.
Other Mathematical/Statistical Anomalies
Below is a list of other interesting mathematical anomalies.
While some have more tenuous relationships with investing, they all support the idea that statistical conclusions shouldn’t go unquestioned.
1. The Monty Hall Problem: A classic probability puzzle where switching choices increases your odds of winning, despite seeming like a 50/50. Finance parallel: Investors may instinctively "stick with" losing positions due to sunk cost fallacy or overconfidence, when switching (reallocation) might statistically yield better results.
2. Berkson’s Paradox: A bias where two unrelated variables appear negatively correlated due to a selection filter.
Finance parallel: Screening for "only the best performing" funds may show a false inverse correlation between risk and return. It can also mislead when back testing strategies filtered for only surviving companies.
3. The Birthday Paradox: In a group of just 23 people, there's a 50% chance two share a birthday. Finance parallel: Demonstrates how probabilities scale in non-intuitive ways, useful when discussing clustering of rare market events or tail risks that seem improbable but occur surprisingly often.
4. Benford’s Law: In many naturally occurring datasets, numbers beginning with 1 appear more frequently than 9.
Finance parallel: Can be used to detect fraud in accounting or financial statements since faked numbers often don’t follow this distribution.
5. The Friendship Paradox: On average, your friends have more friends than you do. Finance parallel: Can illustrate how investors may perceive others as outperforming them due to visibility bias (e.g., only hearing about the winners), fostering FOMO and irrational decisions. 6. Goodhart’s Law: “When a measure becomes a target, it ceases to be a good measure.” Finance parallel: Common in investing, once a metric like EPS growth becomes a performance target, companies manipulate accounting to hit it, distorting its original purpose.
6. Goodhart’s Law: “When a measure becomes a target, it ceases to be a good measure.” Finance parallel: Common in investing, once a metric like EPS growth becomes a performance target, companies manipulate accounting to hit it, distorting its original purpose.
7. The Jeffreys–Lindley Paradox: A Bayesian and frequentist test can disagree. P-values can suggest significance even when Bayesian reasoning shows weak evidence. Finance parallel: Highlights how different statistical lenses (like VaR vs. expected shortfall) may lead to opposing risk assessments.
8. Will Rogers Phenomenon: Moving an item from one group to another can improve the averages of both groups. Finance parallel: Rebalancing portfolios by selling losers and buying winners can paradoxically boost both risk-adjusted performance metrics, even if no value was truly added.
Conclusions: What Can Investors Do?
If you don’t question what statistics really mean in the context of your investment decisions, you risk falling into beautifully logical traps that can lead to painful outcomes. Smart investors don’t just look at the numbers, they strive to understand what’s beneath them.

The best recommendation is seek out a professional who is already mindful of these concepts.
But on your own, to improve upon your investment decision acumen, you can:
1. Beware of Averages: Ask: does this “average” describe what really happens over time, or just across a population?
2. Understand the Path: Investing is not a snapshot. It's a journey. Time-averaged outcomeswhat happens to your money as it compounds- matter more than one-off statistics.
3. Disaggregate the Data: Don’t rely on overall performance metrics alone. Look at how performance breaks down across sectors, time periods, or market regimes.
4. Be Wary of Overconfidence in Models: Many investment models are built on assumptions like ergodicity or normal distributions. These can break down in the real world.
5. Look Beyond Returns: Check things like max drawdown which tells you how your investment would look if you had invested at the worst possible time. Also look at risk/reward ratios like Sharpe, Sortino, Calmer. Each has its own advantages and drawbacks but in aggregate they can help you make better informed risk assessments.
When evaluating investment vehicles, the pros will seldom start with “what’s the average return”? Instead, they cut to the chase- and through the noise- and ask about the numbers that are meaningful throughout all market cycles and investment environments; metrics that show what they can expect in the worst-case scenario and what the reward is given the strategy’s risk profile.
They know there is substance behind Warren Buffet’s statement of principle: “Rule No. 1: Never lose money. Rule No. 2: Never forget Rule No. 1” and that it’s a heck of a lot easier to preserve capital by avoiding holes rather than having to dig out of one.
And there’s no reason the average investor real investor living in real time shouldn’t be doing the same.
John Hanna, Director of Operations
Disclosure
Chatham Wealth Management is registered as an investment adviser with the SEC. SEC registration does not constitute an endorsement of the firm by the Commission, nor does it indicate that the adviser has attained a particular level of skill or ability.
Past performance may not be indicative of future results. All investment strategies have the potential for profit or loss. Different types of investments involve varying degrees of risk, and there can be no assurance that any specific investment or strategy will be profitable for a client's portfolio.